Custon plot for SpatRaster (terra R-package) object based on terra package
Usage
plot_rast(
  r,
  color,
  ncolor = 21,
  proj = FALSE,
  plg = list(tic = "none", shrink = 1),
  pax = list(),
  latitude = TRUE,
  longitude = TRUE,
  int = 10,
  grid = FALSE,
  grid_int = int,
  grid_col = "#666666",
  grid_lwd = 1.2,
  add_range = FALSE,
  show.mean = TRUE,
  ndig = 2,
  log = FALSE,
  range,
  scale,
  min = -3,
  max,
  unit,
  mask,
  fill = FALSE,
  ...
)
Arguments
- r
raster
- color
color scale, or name of a custom color scale (see notes)
- ncolor
number of colors
- proj
TRUE to project the raster to lat-lon
- plg
list of parameters passed to terra::add_legend
- pax
list of parameters passed to graphics::axis
- latitude
add a latitude axis
- longitude
add a longitude axis
- int
interval of latitude and longitude lines
- grid
add grid (graticule style)
- grid_int
interval of grid lines
- grid_col
color for grid lines
- grid_lwd
lwd for the grid lines
- add_range
add legend with max, average and min r values
- show.mean
show the average on legend, default TRUE
- ndig
number of digits for legend_range
- log
TRUE to plot in log-scale
- range
range of original values to plot
- scale
variable multiplier (not affect min/max/range)
- min
minimum log value for log scale (default is -3)
- max
maximum log value for log scale
- unit
title for color bar
- mask
optional SpatVector to mask the plot
- fill
filling NAs
- ...
arguments to be passing to terra::plot
Note
color scales including: 'eva3', 'eva4', 'blues', 'diff', 'rain', 'pur', 'blackpur', 'acid', and 'regime'. Also reverse version with addition of a r ('eva3r' is the default).
Examples
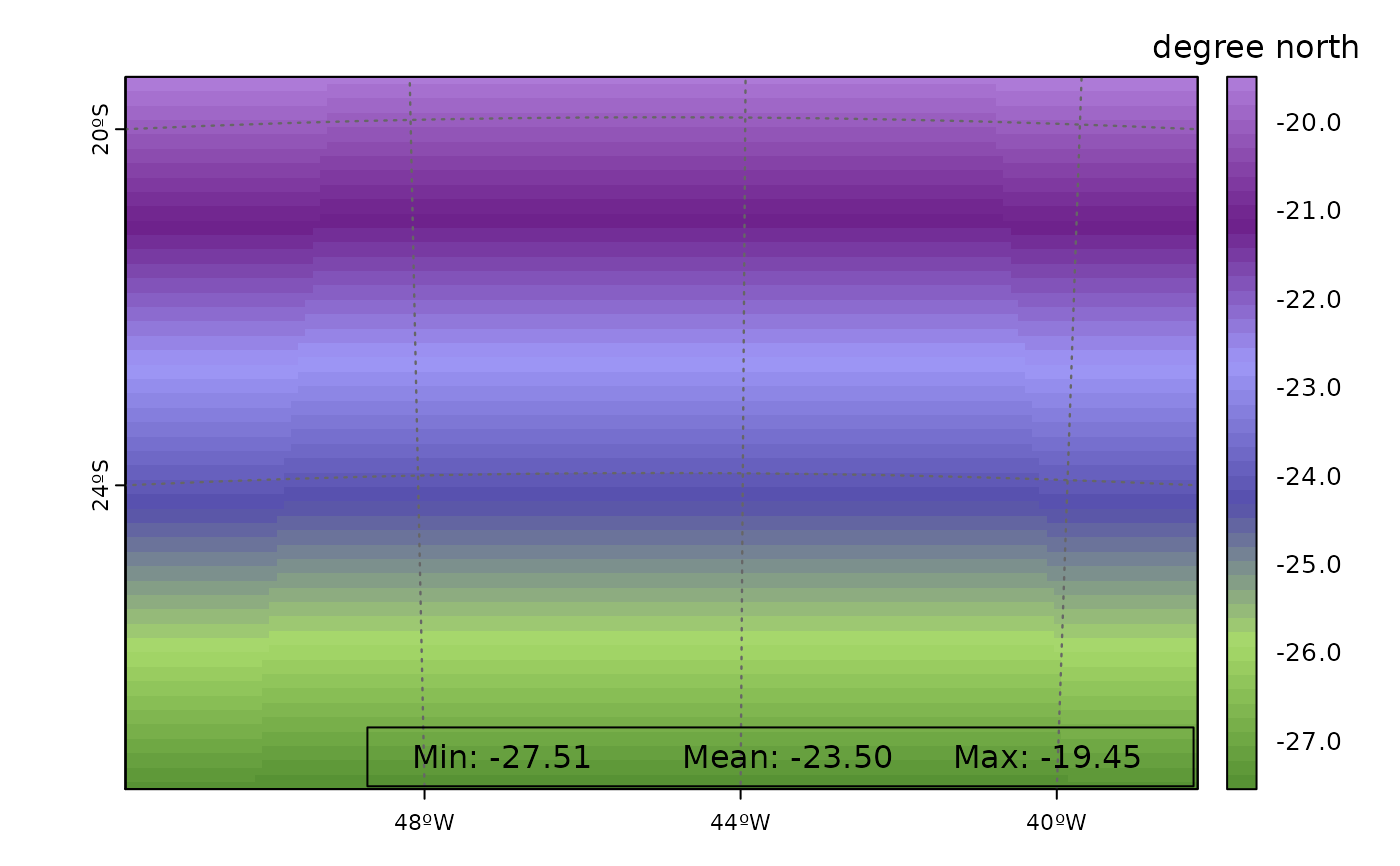
wrf <- paste(system.file("extdata", package = "eva3dm"),
                         "/wrfinput_d01", sep="")

r <- wrf_rast(file=wrf, name='XLAT')

plot_rast(r)