Custon plot for SpatRaster (terra R-package) object based on terra package
Arguments
- p
SpatVector points
- z
column name or a vector of values to plot
- col
color for the point
- col2
color for the outline
- lim
range of values for scale
- symmetry
calculate symmetrical scale
- pch
type of point
- pch2
type of point for contour
- cex
character expansion for the points
- cex2
character expansion for the contour
- outside
to include values outside range
- add
add to existing plot
- plg
list of parameters passed to terra::add_legend
- pax
list of parameters passed to graphics::axis
- unit
used title in terra::add_legend
- expand
to expand the plot region
- ...
arguments to be passing to terra::plot
Examples
sp<- terra::vect(paste0(system.file("extdata",package="eva3dm"),"/masp.shp"))
BR<- terra::vect(paste0(system.file("extdata",package="eva3dm"),"/BR.shp"))

p    <- readRDS(paste0(system.file("extdata",package="eva3dm"),"/sites_AQ_BR.Rds"))
p$id      <- row.names(p)
point     <- terra::vect(p)
point$NMB <- 1:45 - 20 # some values to plot
#> Warning: [$<-] replacement is not a multiple of the number of rows

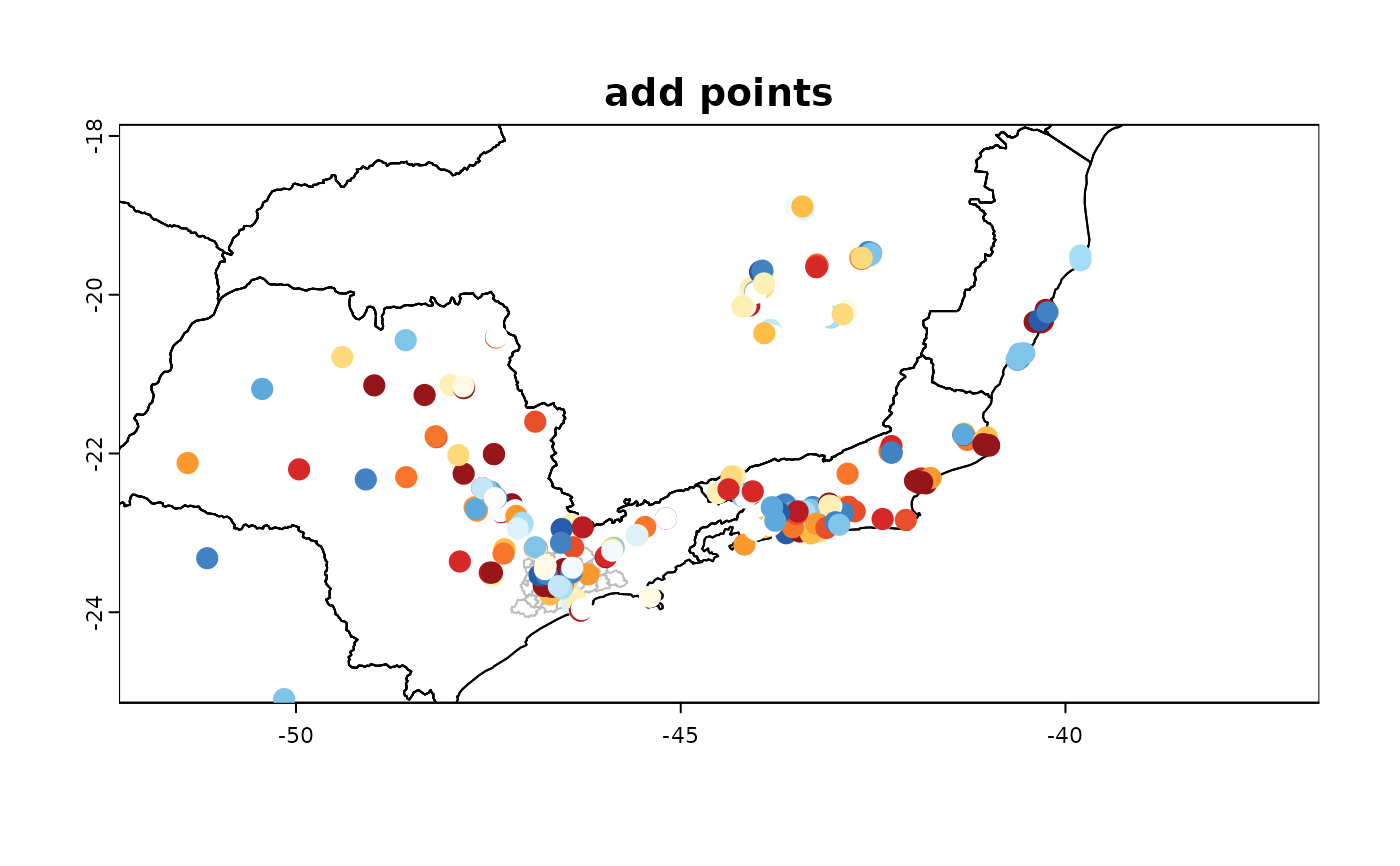
terra::plot(BR, main = 'add points',xlim = c(-52,-37),ylim = c(-25,-18))
terra::lines(BR)
terra::lines(sp, col = 'gray')
overlay(point,point$NMB,cex = 1.4, add = TRUE)


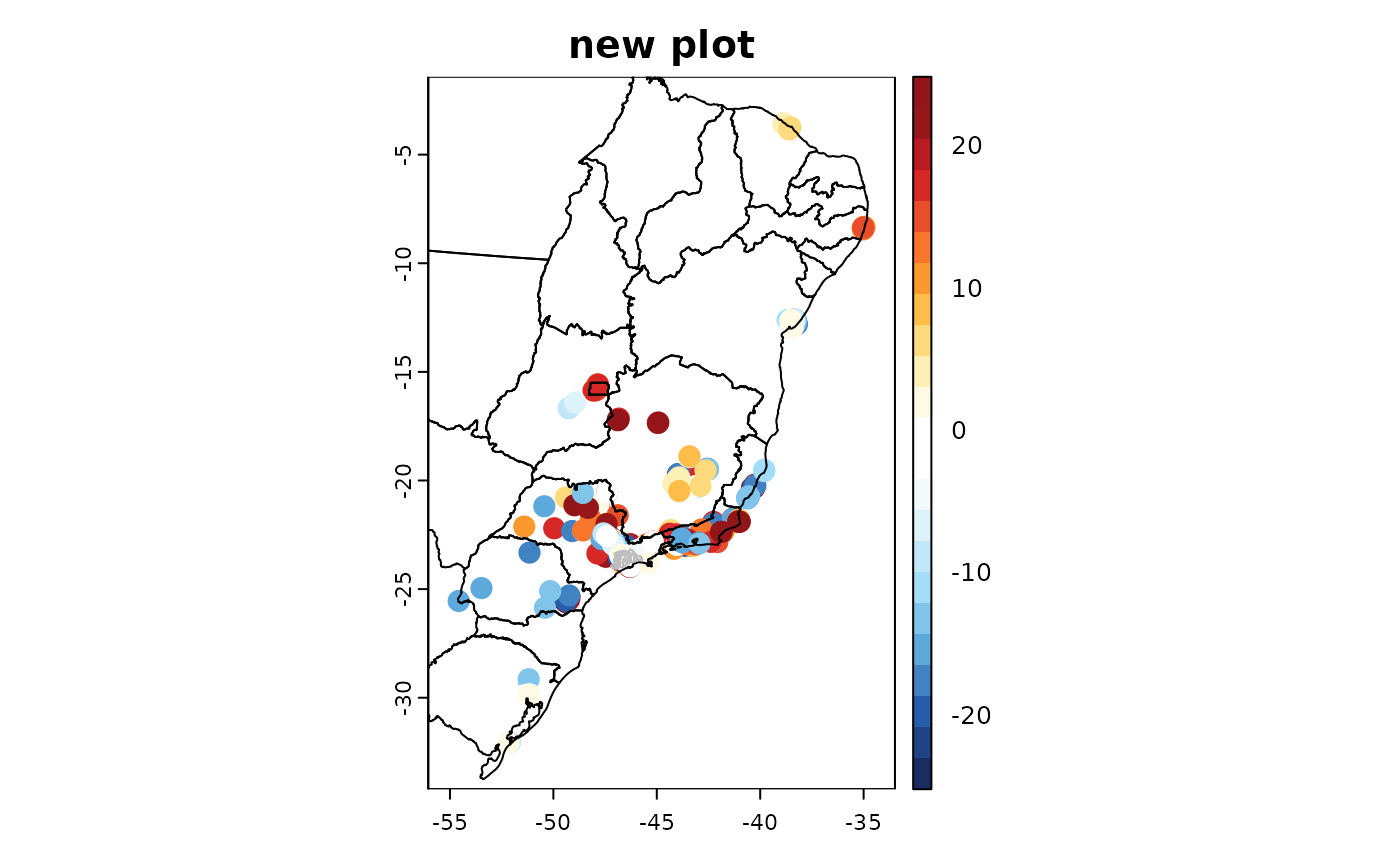
overlay(point,point$NMB,cex = 1.4, add = FALSE, main = 'new plot')
terra::lines(BR)
terra::lines(sp, col = 'gray')

