Calculate traditional statistics related to a threshold
Usage
cate(
  model,
  observation,
  threshold,
  cutoff = NA,
  nobs = 8,
  rname,
  to.plot = FALSE,
  col = "#4444bb",
  pch = 19,
  lty = 3,
  lcol = "#333333",
  lim,
  verbose = TRUE,
  ...
)
Arguments
- model
numeric vector with paired model data
- observation
numeric vector with paired observation data
- threshold
reference value
- cutoff
(optionally the maximum) valid value for observation
- nobs
minimum number of observations
- rname
row name
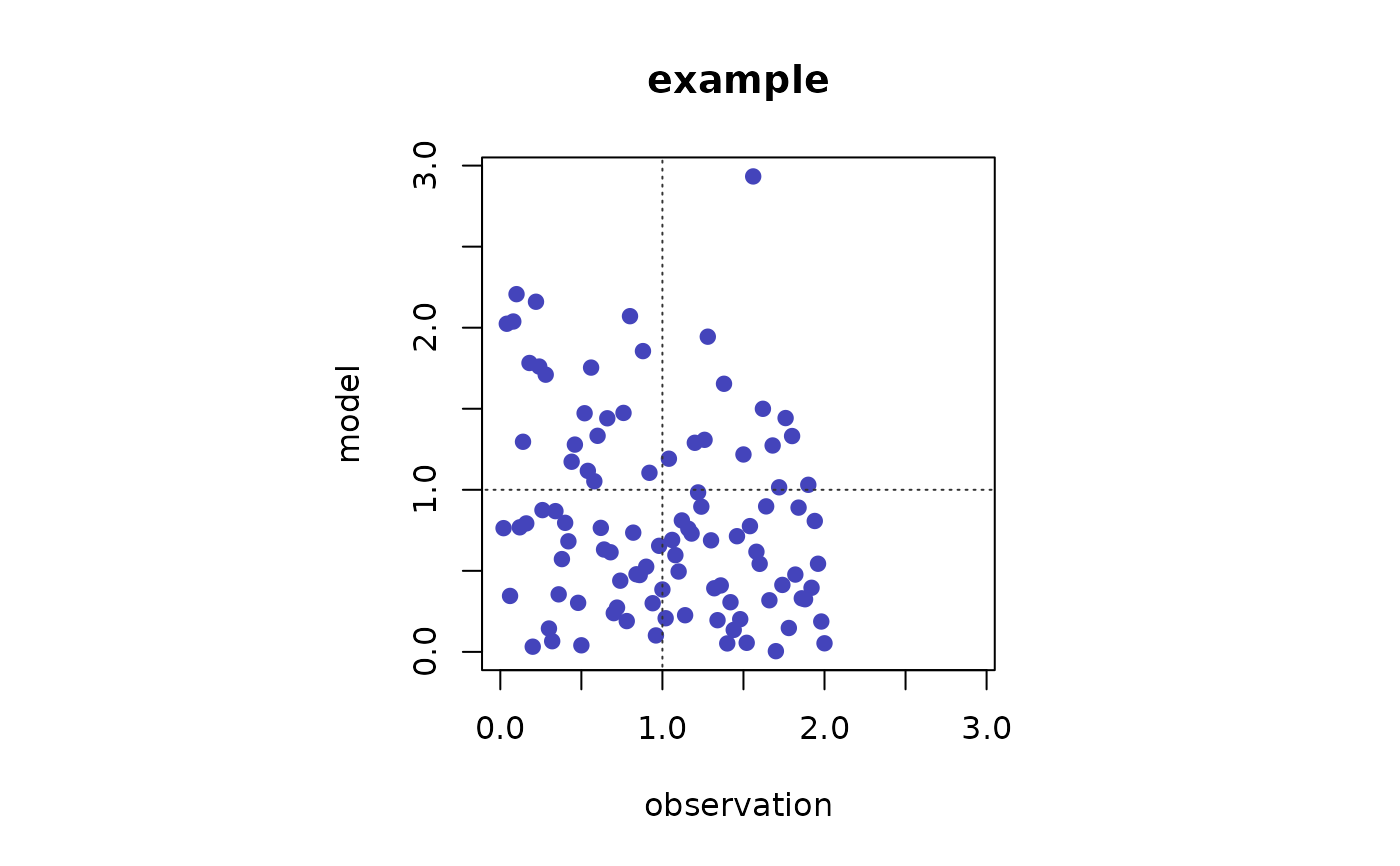
- to.plot
TRUE to plot a scatter-plot
- col
color for points
- pch
pch of points
- lty
lty of threshold lines
- lcol
col of threshold lines
- lim
limit for x and y
- verbose
display additional information
- ...
arguments passed to plot
Value
a data.frame including: Accuracy (A); Critical Success Index (CSI); Probability of Detection (POD); Bias(B); False Alarm Ratio (FAR); Heidke Skill Score (HSS); Pearce skill Score (PSS) in
References
Gandin, L. S., & Murphy, A. H. (1992). Equitable skill scores for categorical forecasts. Monthly weather review, 120(2), 361-370.